
Microsoft Free Cash Flow Beats Estimates While Alphabet Turns Negative on AI Capex
Why it matters
Hyperscaler earnings are establishing a structural divide across global capital markets, penalizing balance sheets that absorb negative cash flow to sustain data center expansion while rewarding operators who maintain positive cash yields alongside rapid cloud growth.
What happened (in 30 seconds)
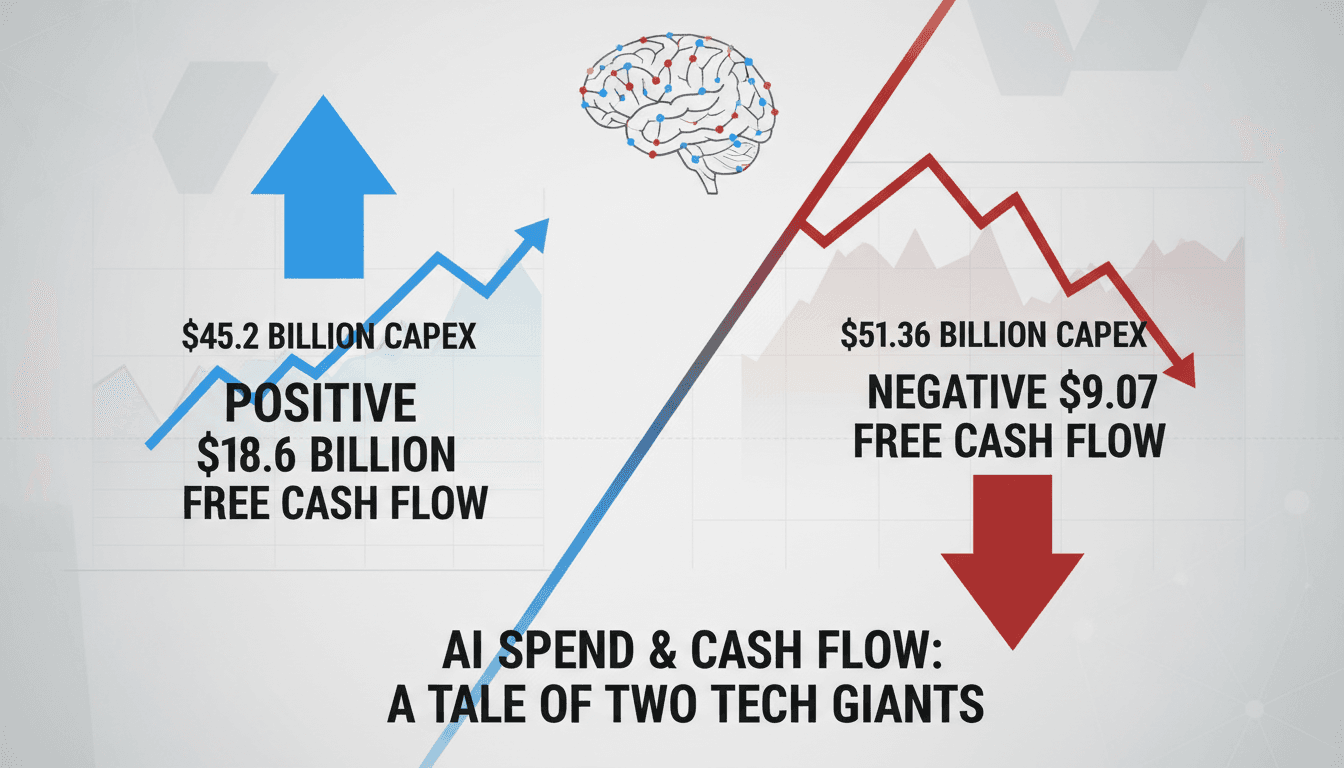
- Divergent cash outcomes materialized: On October 28, 2026, Microsoft reported fiscal Q1 2027 revenue of $92.3 billion with $18.6 billion in free cash flow against $45.2 billion in capex, whereas Alphabet reported Q3 2026 revenue of $127.58 billion but recorded negative free cash flow of $9.07 billion after $51.36 billion in capex.
- Cloud segments expanded across both firms: Microsoft Azure posted a revenue increase of 48% to reach $33.17 billion, while Alphabet’s Google Cloud doubled its quarterly revenue to reach $30.71 billion.
- Equity markets reacted along liquidity lines: Microsoft shares gained more than 5% in after-hours trading as cash delivery surpassed consensus projections, while Alphabet shares dropped between 8% and 10% on cash burn concerns.
The context you actually need
- Aggressive infrastructure acceleration throughout 2025–2026: Leading cloud providers intensified capital deployment toward specialized chips, data centers, and power capacity to serve enterprise artificial intelligence workloads, testing balance sheet tolerance.
- Investor metrics shifted from top-line expansion to capital discipline: Wall Street transitioned from rewarding broad capacity additions to demanding proof that multi-billion-dollar infrastructure allocations yield immediate, accretive free cash flows.
- Supply chain friction altered expenditure profiles: Microsoft’s quarterly capital expenditure of $45.2 billion came in below its projected $50 billion target due to supply delays, an operational constraint that temporarily preserved near-term cash buffers relative to Alphabet’s sustained $51.36 billion outlay.
What's really happening
The post-earnings divergence between Microsoft and Alphabet marks a distinct shift in hyperscaler corporate finance: capital allocation discipline has replaced capacity expansion as the primary valuation benchmark. For the past eight quarters, institutional capital accepted compressed margins under the thesis that securing computing capacity was a prerequisite for platform dominance. The October 28, 2026 disclosures altered that framework by exposing the differing balance sheet costs required to generate enterprise cloud revenue.
Alphabet’s results illustrate the mechanics of capex-induced cash drain. Despite doubling Google Cloud revenue to $30.71 billion, Alphabet recorded negative free cash flow of $9.07 billion after deploying $51.36 billion into capital expenditures during a single quarter. In effect, the cash required to acquire physical facilities, specialized computing silicon, and power infrastructure outpaced operating cash generation. While top-line enterprise demand remained robust, the operating cash conversion cycle deteriorated. When capex reaches 40% of total revenue within a single reporting period, baseline operating leverage weakens unless unit monetization scales concurrently.
Microsoft operated under an inverted mechanical dynamic. Azure generated $33.17 billion in revenue, growing 48%, while enterprise sales supported an overall revenue base of $92.3 billion. Even after committing $45.2 billion in capital expenditures, Microsoft retained $18.6 billion in positive free cash flow, significantly outperforming consensus estimates of $8.54 billion. Part of this cash preservation was driven by operational bottlenecks: management had projected capex closer to $50 billion, but hardware and facility delivery delays prevented the deployment of roughly $4.8 billion. That timing variation, combined with enterprise software margins, provided an immediate operational cushion.
This divergence reveals an underlying structural reality for institutional portfolios. The hyperscaler buildout is no longer evaluated as a uniform tide lifting the broader technology sector. Markets are establishing distinct tiers based on balance sheet resilience. When two direct competitors execute similar data center expansions but experience a net quarterly liquidity variance exceeding $27.6 billion, investors immediately reprice capital risk. Capital allocation models are shifting from rewarding long-term capacity potential to demanding tangible proof that recurring enterprise contract revenues can absorb ongoing infrastructure outlays without requiring net cash deficits.
Who feels it first (and how)
- Enterprise CIOs and IT procurement leads: Infrastructure pricing structures will come under review as providers facing negative free cash flow seek to protect margins through tightened discounting on compute commitments.
- Global asset managers and institutional allocators: Multi-asset portfolios and sovereign wealth funds holding large index concentrations must adjust for single-stock dispersion among mega-cap tech holdings.
- Data center operators and equipment vendors: Supply delivery cadences will face heightened scrutiny as hyperscalers calibrate physical deployment schedules to match quarterly cash flow targets.
What to watch next
- Hardware deployment normalization timelines: Monitor whether Microsoft’s capex rebounds toward or exceeds the previously projected $50 billion threshold once supply delays resolve, which will test whether its free cash flow strength persists.
- Alphabet’s operating cash conversion metrics: Track whether Google Cloud can sustain its 100% growth trajectory while stabilizing net cash generation, or if management will be forced to moderate infrastructure outlays.
- Comparative operating margin trends: Watch subsequent quarterly releases for indications of whether the widening gap between capex intensity and cash return triggers selective pricing adjustments across hyperscale enterprise tiers.
Microsoft delivered $18.6 billion in free cash flow against $45.2 billion in capex, while Alphabet generated negative $9.07 billion in free cash flow following $51.36 billion in capex. Azure reached $33.17 billion in revenue, and Google Cloud reached $30.71 billion.
Equity markets will enforce wider valuation spreads between hyperscalers that maintain self-funded infrastructure cycles and those that experience multi-quarter cash drains.
Whether enterprise software revenue growth rates will accelerate quickly enough to offset elevated capex baselines once supply chain constraints normalize across all primary cloud operators.
Frequently Asked Questions
- Why it matters?
- Hyperscaler earnings are establishing a structural divide across global capital markets, penalizing balance sheets that absorb negative cash flow to sustain data center expansion while rewarding operators who maintain positive cash yields alongside rapid cloud growth.
- What happened (in 30 seconds)?
- Divergent cash outcomes materialized: On October 28, 2026, Microsoft reported fiscal Q1 2027 revenue of $92.3 billion with $18.6 billion in free cash flow against $45.2 billion in capex, whereas Alphabet reported Q3 2026 revenue of $127.58 billion but recorded negative free cash flow of $9.07 billion after $51.36 billion in capex. Cloud segments expanded across both firms: Microsoft Azure posted a revenue increase of 48% to reach $33.17 billion, while Alphabet’s Google Cloud doubled its quarterl
- What's really happening?
- The post-earnings divergence between Microsoft and Alphabet marks a distinct shift in hyperscaler corporate finance: capital allocation discipline has replaced capacity expansion as the primary valuation benchmark. For the past eight quarters, institutional capital accepted compressed margins under the thesis that securing computing capacity was a prerequisite for platform dominance. The October 28, 2026 disclosures altered that framework by exposing the differing balance sheet costs required to
- Who feels it first (and how)?
- Enterprise CIOs and IT procurement leads: Infrastructure pricing structures will come under review as providers facing negative free cash flow seek to protect margins through tightened discounting on compute commitments. Global asset managers and institutional allocators: Multi-asset portfolios and sovereign wealth funds holding large index concentrations must adjust for single-stock dispersion among mega-cap tech holdings. Data center operators and equipment vendors: Supply delivery cadences wi
- What to watch next?
- Hardware deployment normalization timelines: Monitor whether Microsoft’s capex rebounds toward or exceeds the previously projected $50 billion threshold once supply delays resolve, which will test whether its free cash flow strength persists. Alphabet’s operating cash conversion metrics: Track whether Google Cloud can sustain its 100% growth trajectory while stabilizing net cash generation, or if management will be forced to moderate infrastructure outlays. Comparative operating margin trends: W
Technology business and AI-related headlines.
"Data-driven tech newsroom with global scope."
— A47 Editor
Microsoft, Alphabet Earnings Put Focus on AI Cash Flow Drain
Shares of Microsoft Corp. and Alphabet Inc. have diverged since their most recent earnings reports, as Wall Street increasingly scrutinizes how heavy artificial intelligence spending is weighing on corporate cash flow and bottom lines. Both companies...
Technology business news, market impacts, and innovation trends.
"Bloomberg is a premier financial and tech news provider, respected for its in-depth reporting and analytical rigor."
— A47 Editor
Microsoft, Alphabet Earnings Put Focus on AI Cash Flow Drain
Shares of Microsoft Corp. and Alphabet Inc. have diverged since their most recent earnings reports, as Wall Street increasingly scrutinizes how heavy artificial intelligence spending is weighing on corporate cash flow and bottom lines. Both companies...
Global markets, investing, and macroeconomics from a premier financial newsroom.
"Bloomberg is respected for in-depth financial reporting and data-driven analysis."
— A47 Editor
Microsoft, Alphabet Have a Lot to Prove to AI Skeptics
Shares of Microsoft and Alphabet have underperformed the broader market this year as investors voice concerns over the heavy spending both companies are directing toward artificial intelligence, according to Bloomberg's coverage of the two tech giant...
Technology business and AI-related headlines.
"Data-driven tech newsroom with global scope."
— A47 Editor
Microsoft and Alphabet Earnings Put Focus on AI Cash Flow Drain
Microsoft Corp. and Alphabet Inc. shares have diverged since their most recent earnings reports, as investors increasingly scrutinize how heavy artificial intelligence spending is weighing on corporate cash flow and bottom lines.
Technology business news, market impacts, and innovation trends.
"Bloomberg is a premier financial and tech news provider, respected for its in-depth reporting and analytical rigor."
— A47 Editor
Microsoft and Alphabet Earnings Put Focus on AI Cash Flow Drain
Microsoft Corp. and Alphabet Inc. shares have diverged since their most recent earnings reports, as investors increasingly scrutinize how heavy artificial intelligence spending is weighing on corporate cash flow and bottom lines.
Curated tech headlines including AI stories.
"Influential aggregator surfacing the day’s top tech/AI links."
— A47 Editor
Alphabet, Amazon, and Microsoft are expected to report double-digit gains in revenue this week, as investors grow impatient with AI capex and seek returns (Bloomberg)
Alphabet, Amazon, and Microsoft are expected to report double-digit revenue gains when they release earnings this week, even as investors grow impatient with the heavy capital spending these companies are directing toward artificial intelligence and ...