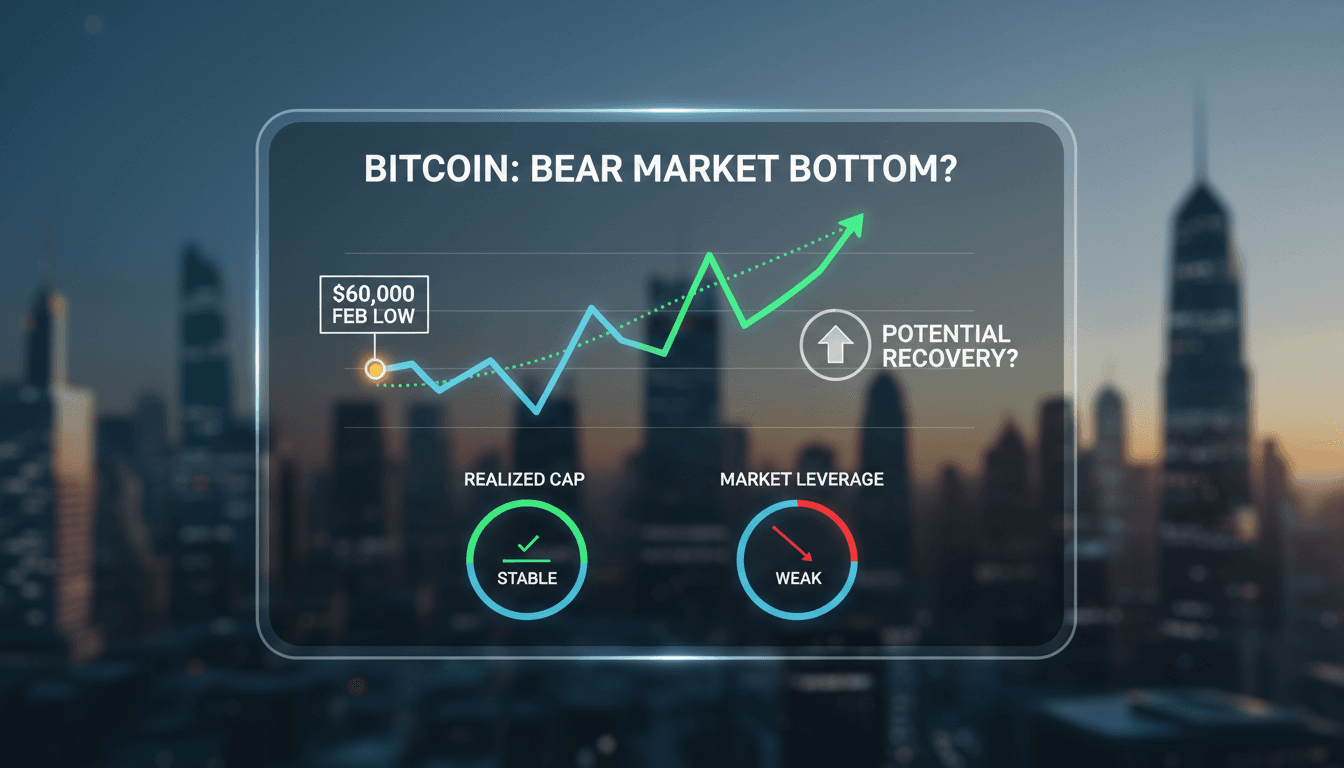
Bitcoin's February low of $60,000 may signal the end of the current bear market
Here's what it means for you.
This analysis could indicate a pivotal moment for Bitcoin investors.
What happened
K33 Research claims that Bitcoin's February low of $60,000 is likely the bear market's maximum drawdown.
The Context
- Realized cap stabilization and negative funding rates suggest a potential cycle low for Bitcoin.
- K33 highlights weak leverage and ETF outflows as indicators of market conditions.
- Historical metrics like elevated RHODL readings support the argument for the $60K bottom.
Takeaway
If the $60,000 level holds, it could signal a shift in market sentiment and a potential recovery phase for Bitcoin.
Real-time updates, analysis, and reports on the blockchain and cryptocurrency sectors.
"Crypto News delivers real-time updates, analysis, and reports on the blockchain and cryptocurrency sectors."
— A47 Editor
Bitcoin’s $60K bottom still holds? K33 says this cycle is different
Bitcoin's recent price action has seen a low of $60,000, which K33 Research suggests may represent the maximum drawdown of the current bear market, indicating a less severe decline compared to historical trends.
Covers blockchain, cryptocurrency news, project analysis, and market insights.
"CoinDesk is a well-established cryptocurrency and blockchain news provider, offering comprehensive insights, market data, and industry research."
— A47 Editor
These bitcoin metrics suggest February’s $60,000 selloff may have marked the bottom
Recent metrics suggest that Bitcoin's selloff in February, which saw prices drop to $60,000, may have marked a significant bottom for the cryptocurrency. Indicators such as realized cap stabilization, elevated RHODL readings, and negative funding rat...
Covers Bitcoin plus altcoin news, market updates, and educational resources.
"Bitcoin.com provides news, market data, and guides focused on Bitcoin and the wider crypto industry."
— A47 Editor
K33 Research Says Bitcoin’s $60K Bottom Was Bear Market’s Maximum Drawdown
K33 Research has reported that Bitcoin's recent low of $60,000 marked the maximum drawdown of the current bear market, suggesting a relatively shallow decline compared to historical trends. This analysis indicates that the bear market's severity may ...